Metrics and calculations
Below is every metric shown in Analytics and how it is calculated for the selected time range.Overview
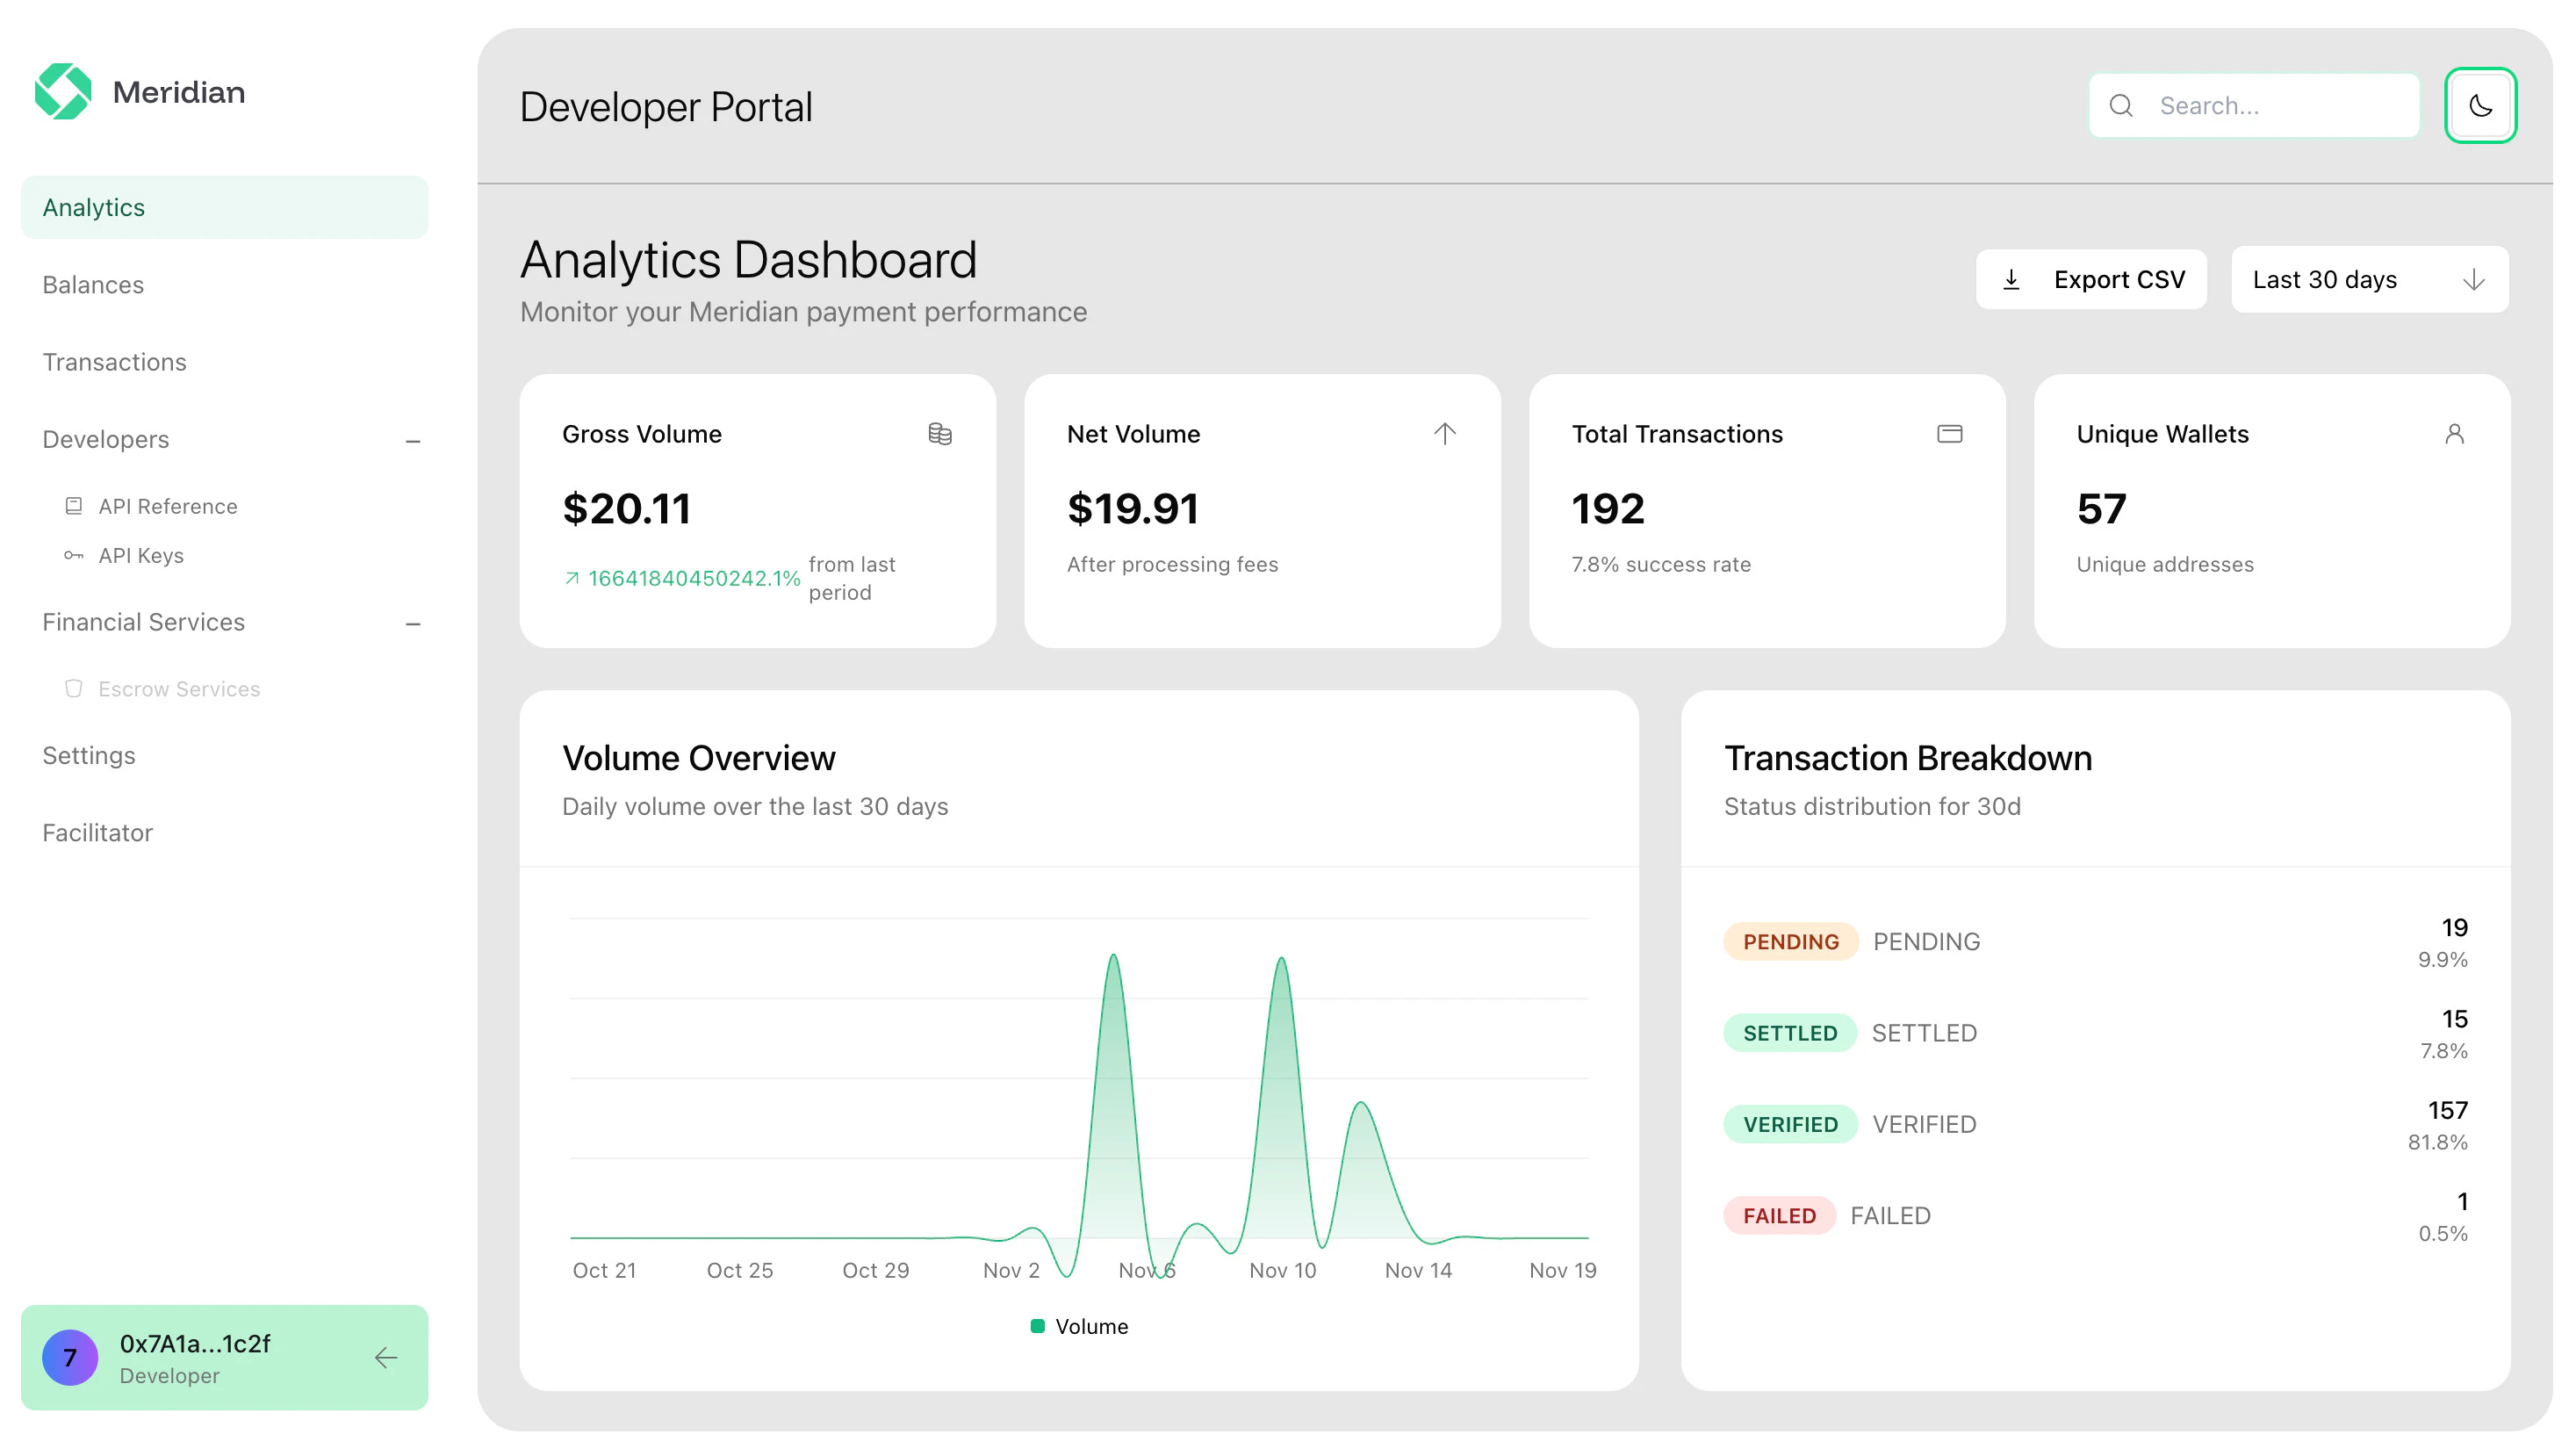
- Total transactions: Count of all transactions in the time range.
- Total volume: Sum of transaction amounts in the time range.
- Average transaction value: Average of transaction amounts in the time range.
- Success rate:
(settledTransactions / totalTransactions) × 100, where “settled” meansstatus = SETTLED. - Volume trend %: Percentage change in total volume vs the previous period of the same length (previous period ends one day before the current start).
Breakdowns
- By status: Count and percentage of total transactions per status.
percentage = (statusCount / totalTransactions) × 100. - By network: Count, volume, and percentage of total transactions per
network.
percentage = (networkCount / totalTransactions) × 100. - Daily: Count and volume aggregated per day, with missing days shown as 0.
- Hourly distribution: Count and volume aggregated per hour of day.
- Weekly trends: Count and volume aggregated per week.
What you can analyze
- Volume and totals by time range.
- Top receivers by activity.
- Success vs refund rates for operational health.